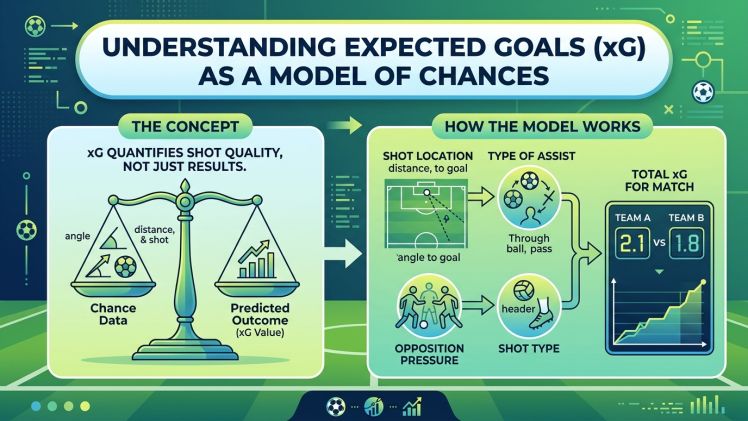
A score tells us how many goals were scored. An expected goals model asks a different question about the chances that produced the attempts. Shortened to xG, the metric assigns a probability to a shot using characteristics associated with similar historical opportunities. Its usefulness comes from making chance quality discussable, provided the model remains a measurement with assumptions and limits.
The decimal can look more precise than the underlying explanation. A value of 0.20 means the model assigns that opportunity a probability of twenty percent. It does not describe a promise owed to the attacker or an instruction about what the next shot must do.
Begin With the Opportunity
Distance and angle help explain why two attempts differ. A central shot close to goal offers a different view from a difficult effort near the touchline. Models can also use body part and information about the preceding action. Some include additional detail about defenders and the goalkeeper.
Readers encountering xG discussions while exploring ligaciputra can begin by asking which model supplied the number. Different providers can include different information or process an event differently. The decimal becomes easier to interpret when its source is known and comparisons use the same method.
An xG figure concerns the shot at a particular moment. It may leave out a promising attack that ended before anyone attempted to score. A pass narrowly beyond a striker can matter to the match while contributing no shot value to the familiar total. Video remains valuable for understanding those unfinished attacks.
Add Values Without Inventing a Score
Suppose a fictional team takes three shots valued at 0.10, 0.20 and 0.30. Their sum is 0.60 expected goals. That total describes accumulated shot probabilities. The team can still finish with zero goals, one goal or another actual outcome allowed by the events.
It would be misleading to round 0.60 automatically to one deserved goal. Summation creates a common scale for comparing opportunities; it does not replay the match with a predetermined score. Football results remain discrete while the model summarizes chances through decimal values.
The sequence also matters. Several attempts from one scramble may share circumstances that a simple total conceals. A rebound exists because the previous effort did not already end the attack. Read the provider’s treatment before using a crowded sequence as though it were several independent complete attacks.
Keep Model Outputs Comparable
When reviewing a season chart, check whether penalties are included and whether every fixture uses the same coverage. A nonpenalty total answers a narrower question than a combined figure. Missing matches can distort the comparison even when every visible decimal was recorded accurately.
Avoid blending figures from several models into an apparently seamless trend. A change in provider can look like a change in performance. If different sources are unavoidable, label the break and keep the conclusions modest enough to reflect that uncertainty.
Use one clearly labeled measure throughout each comparison. The treatment of finishing is another useful distinction. A model of the opportunity before the shot describes different information from an assessment that includes where the ball traveled afterward. Read the measure’s name and explanation before treating those outputs as interchangeable. A well placed finish and a favorable starting position concern different stages of the attempt.
To test your understanding, describe a chance without mentioning whether it became a goal. State the location, the angle and the relevant conditions visible before the strike. Then describe the execution separately. This exercise makes it harder for the final outcome to color every earlier judgment. A saved effort can come from a strong opportunity, and a spectacular goal can emerge from an unfavorable one. Keeping those two descriptions separate preserves what the model was trying to estimate and gives the finish a clear place in the subsequent football discussion.
Use Video to Ask Better Questions
A useful replay review starts with an apparent puzzle. Perhaps the xG total is high while the attack felt unconvincing. Examine whether a small number of opportunities carried most of the value. That pattern differs from regularly creating useful positions across the match.
Alternatively, a low total may accompany repeated dangerous entries that failed at the final pass. The model and the observation can both be accurate because they concern different stages. Describing the missing shot helps explain the gap without dismissing the statistic or elevating a personal impression above all evidence.
Player technique deserves separate discussion too. A model estimate is built from selected characteristics and historical data. It cannot contain every detail a viewer notices. Treat an unusual finish as an event to describe, while resisting the temptation to redesign the entire interpretation around one memorable moment.
Write a Conclusion With a Clear Scope
A reader returning through ligaciputra login can keep a match note with both the score and the xG source. Add what the chance distribution showed. For example, note whether two central chances accounted for most of the total or whether attempts came repeatedly from difficult angles.
This produces a useful statement about attacking opportunities. It avoids announcing that the match should have ended at an invented decimal score. It also keeps a model estimate from becoming a guarantee about a future fixture, where the players and circumstances will be different.
Longer runs of matches can help identify recurring attacking patterns, but the collection still needs consistent definitions. Compare like with like, keep unusual circumstances visible and ask whether the trend appears in the footage. A persuasive interpretation connects the arithmetic with the situations being measured.
Expected goals is most helpful as a disciplined question about chances. Learn what enters the model, understand how shot values are added and explain the match context around the total. Those habits make the statistic a practical companion to watching football and leave room for the events that its chosen design cannot capture.
Completing ligaciputra daftar should remain separate from deciding what a statistical model means. Give the chart its own reading time. Identify the sample, the provider and the included events before accepting a confident summary attached to it. This preserves the reasoning behind the number instead of letting the visual prominence of a decimal settle the discussion.